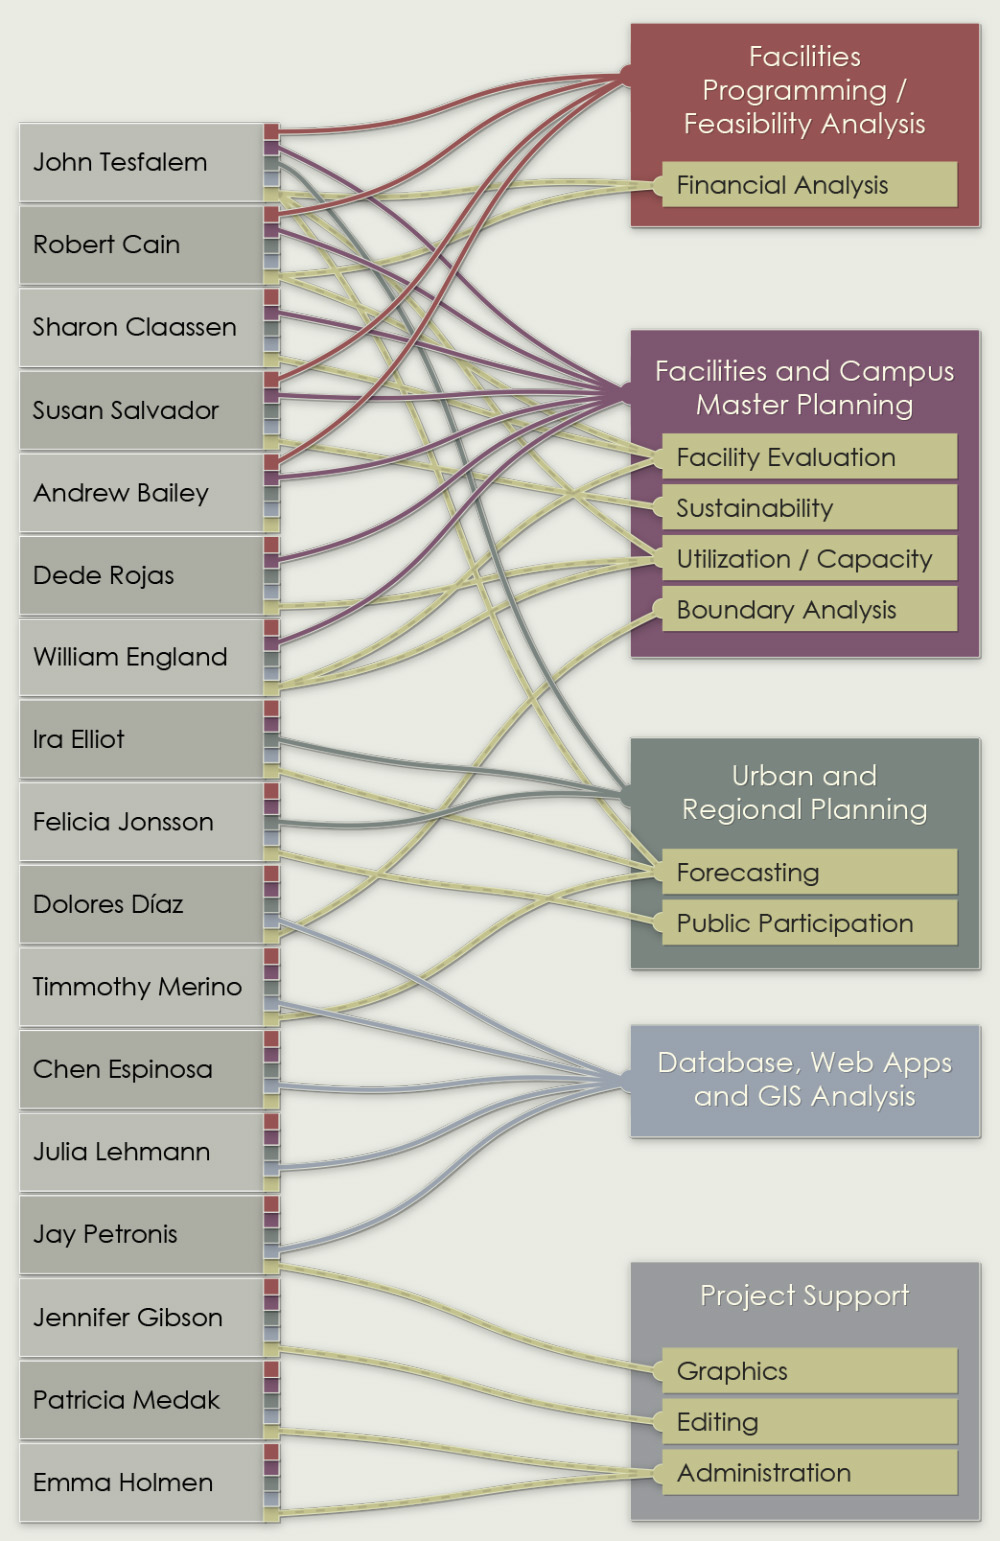
A bare corporate staffing diagram, or org chart, tends to express little more than an organization’s hierarchy, meaningless to outsiders. Or it may inadvertently make a statement about the institution’s convoluted bureaucracy.
This 2013 diagram attempts to convey the capabilities of a flat-level corporation, calling attention to the specialities of each contributor.
The diagram’s basic structure of boxes and lines originated in OmniGraffle, a Mac drawing application well suited for visualizing relational information.
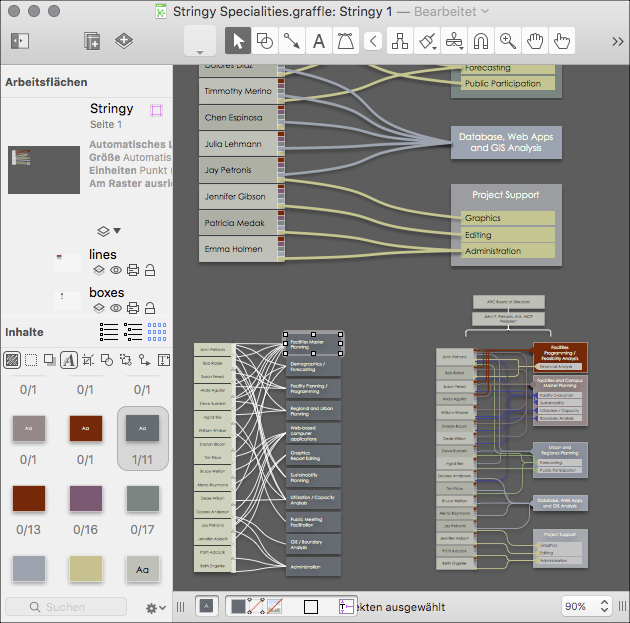
OmniGraffle’s connection lines can anchor themselves to magnetic points on each piece of geometry. Adjusting the position of the objects produces tension and slack in the connection lines.
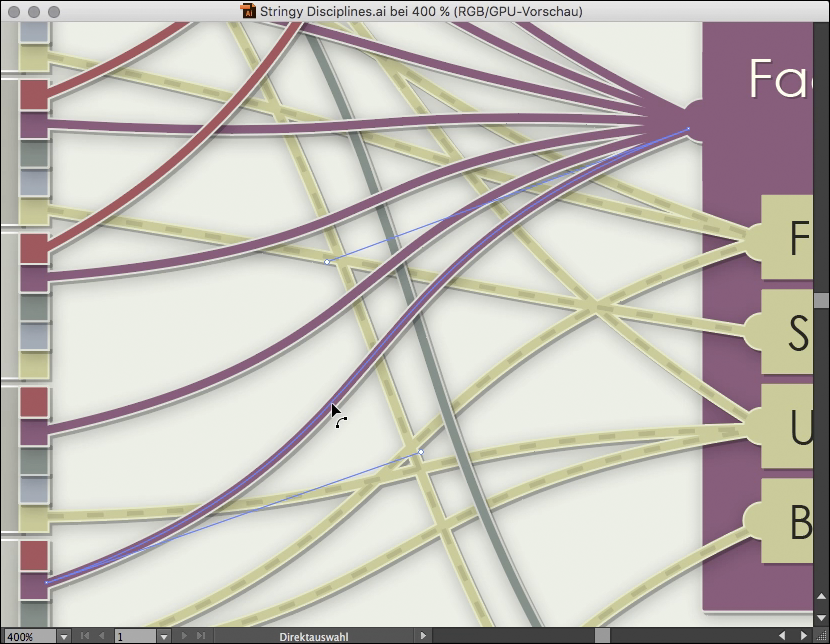
Next, the rough OmniGraffle diagram went to Adobe Illustrator for cleanup and refinement. As of version 6, OmniGraffle’s vector export discards layer structure. But Illustrator’s selection tools can quickly isolate elements and sort them back into layers.
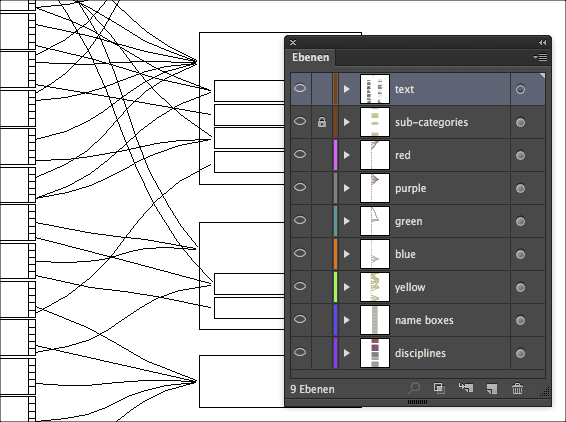
A shaded circle in the layers palette indicates that the layer, object, or group has a dynamic effect attached. The appearance palette contains a list of these applied effects and provides a way to adjust their parameters. Objects placed within an effect-laden container inherit those graphic styles automatically.
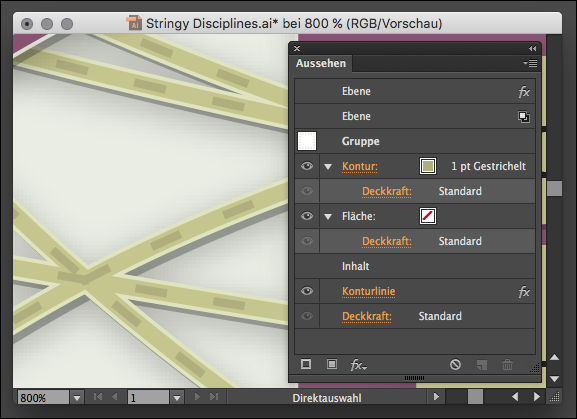
Many paths are simple two-point Bézier curves, easily adjustable using Illustrator’s pen tools.